Histogram
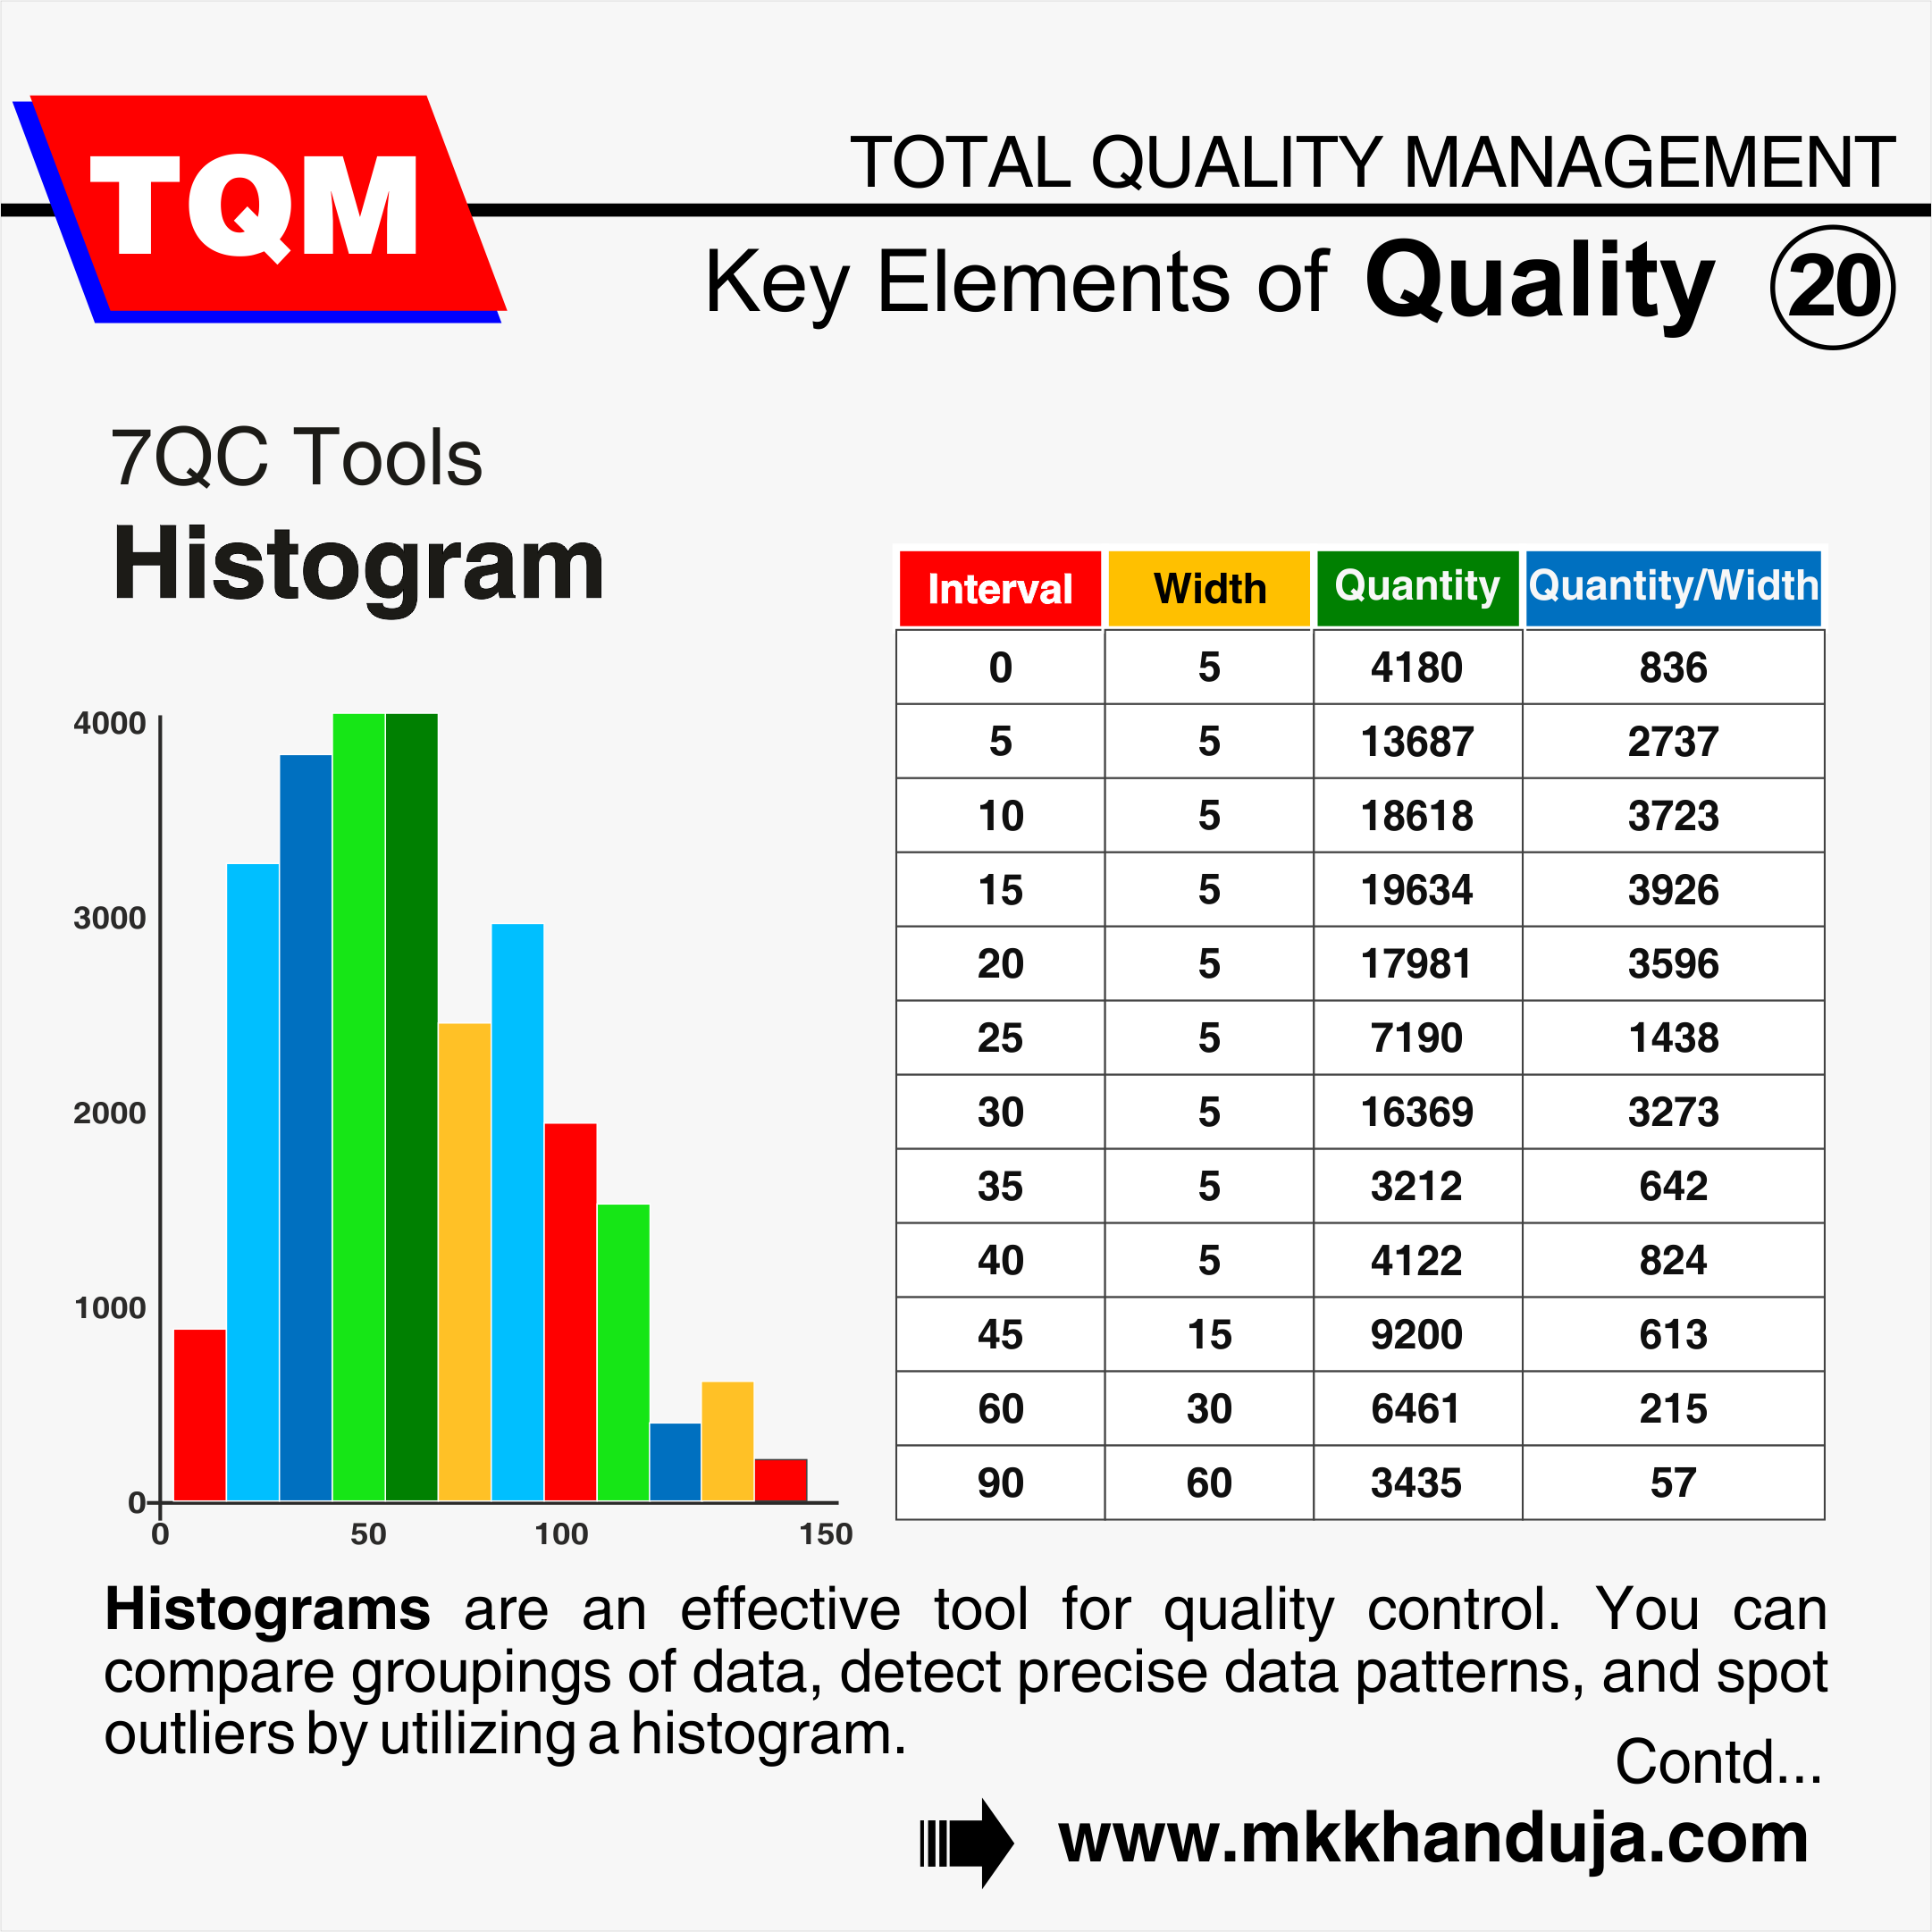
Histograms are an effective tool for quality control. You can compare groupings of data, detect precise data patterns, and spot outliers by utilizing a histogram. These features can help in locating and quantifying process quality problems.
Histograms, a visual depiction of data distribution, can help you understand how your data performs over a range of time intervals. Histograms offer a quick approach to identifying trends and outliers in data as well as identifying possible issues.
The distribution of data is frequently displayed using histograms. A histogram is displayed as a sequence of vertical bars, with each bar's height proportional to the amount of data it reflects, which depicts the frequency or relative frequency of data values.
What Is A Histogram Used For?
Histograms are useful for detecting patterns in data. They
also provide insight into the nature of the data.
- Finding the central tendency of the data set.
- Spotting outliers
- Figuring out whether the data is skewed or regularly distributed.
- Noticing strange occurrences.
- Examining a set of data points variance.
- Looking for anomalies.
- Displaying extensive datasets.
What Are The Good Features Of A Histogram?
- Easy To Understand and Interpret - A histogram is easy to comprehend in a few seconds. It is really easy to read and understand.
- Quickly Visualized - You can quickly construct a histogram since it is simple to create one. This makes it simple to identify patterns and anomalies.
- Helps To Detect Trends - Histogram helps to locate, peaks and valleys. This helps to detect trends.
- Great For Data Sets - Histograms are great for analyzing data sets as they don’t take up enough space.
Helps To Identify Anomalies - A histogram helps to identify anomalies. If you look at the histogram, you can look at spike and dips that tells you about the event that took place.
Comments