Cause and Effect Diagram
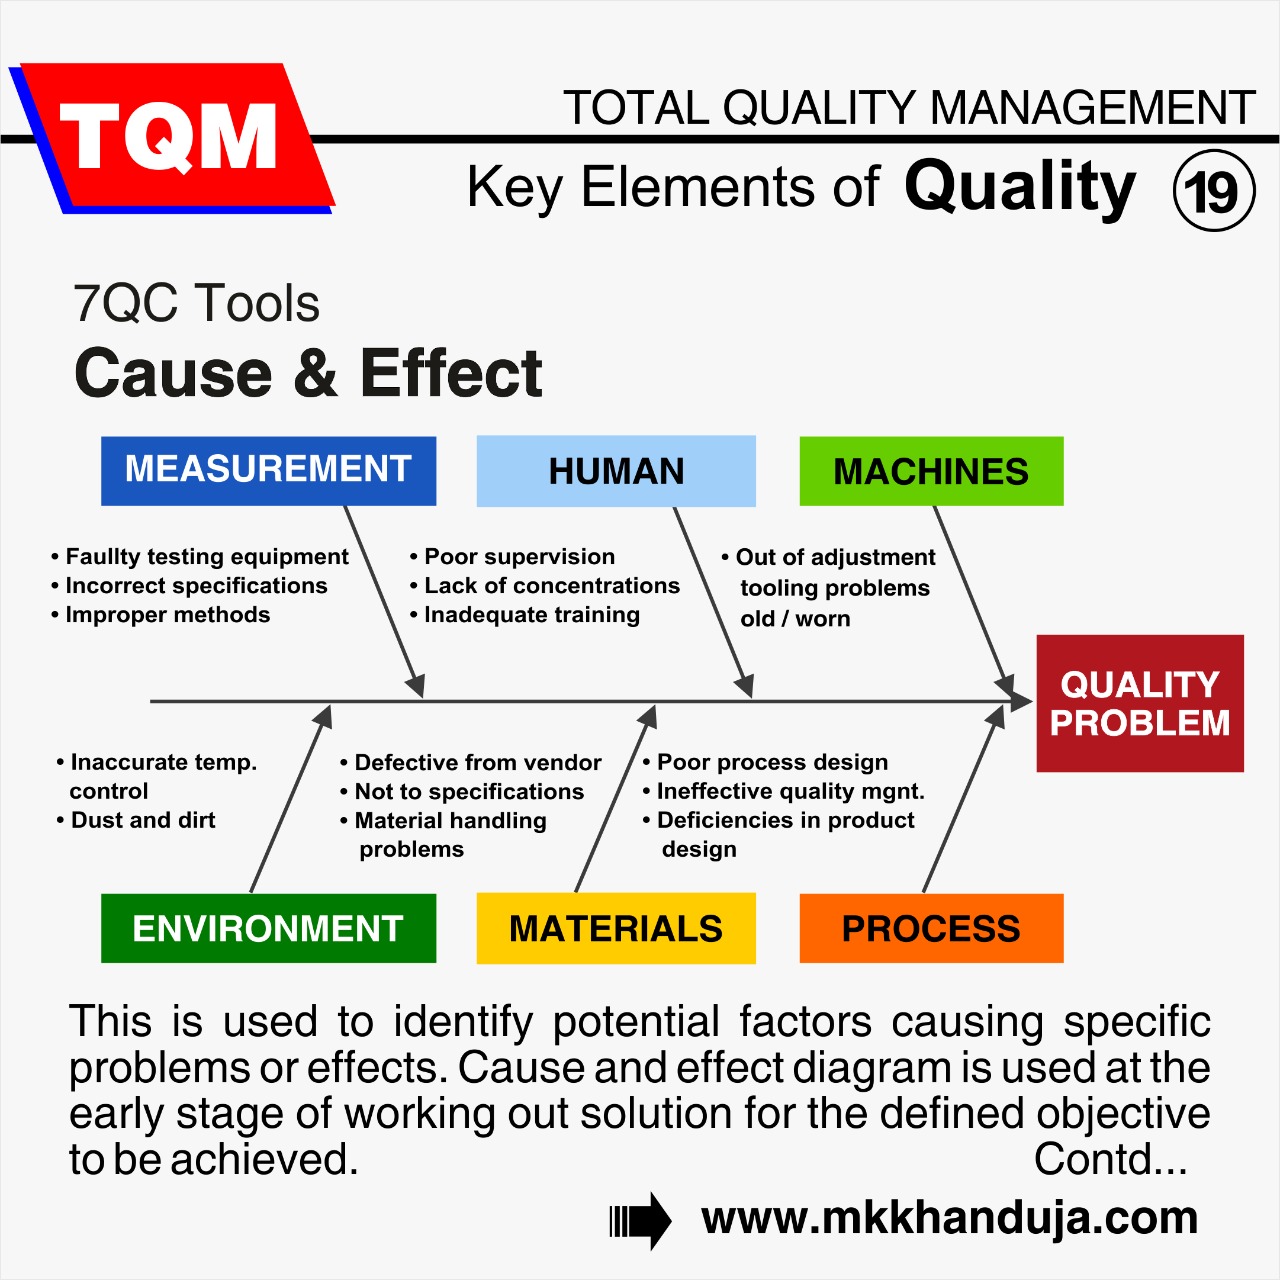
This is used to identify potential factors causing specific problems or effects. Cause and effect diagram is used at the early stage of working out solution for the defined objective to be achieved. The issues identified through tool analysis are quite large in number, the team should narrow down the list to precise causes through level methods.
This tool is also known
as Ishikawa Diagram,
which was developed by Japanese quality
expert Dr. Kaoru Ishikawa. The
causes can be broadly divided into Machine, Man, Materials, Method, Measurement, Management, and mother nature
addressed as 6 Ms. This diagram is also known as the “Fish Bone Diagram” because
it looks like a fish.
The cause and effect diagram illustrates several potential sources for an outcome or issue. It could be utilized by the CFT(Cross Function Terms), and QC team who are familiar with the procedure to organize a brainstorming session. It aims to classify ideas instantly into useful categories.
The key strength of tool is graphic representation, that allows very complex situation to be presented showing clear relationships between elements.
The key strength of tool is graphic representation, that allows very complex situation to be presented showing clear relationships between elements.
When To
Use A Fish Bone Diagram?
- While determining the root of an issue.
- When looking for potential causes of an issue.
- To determine the connection between the impact and other components.
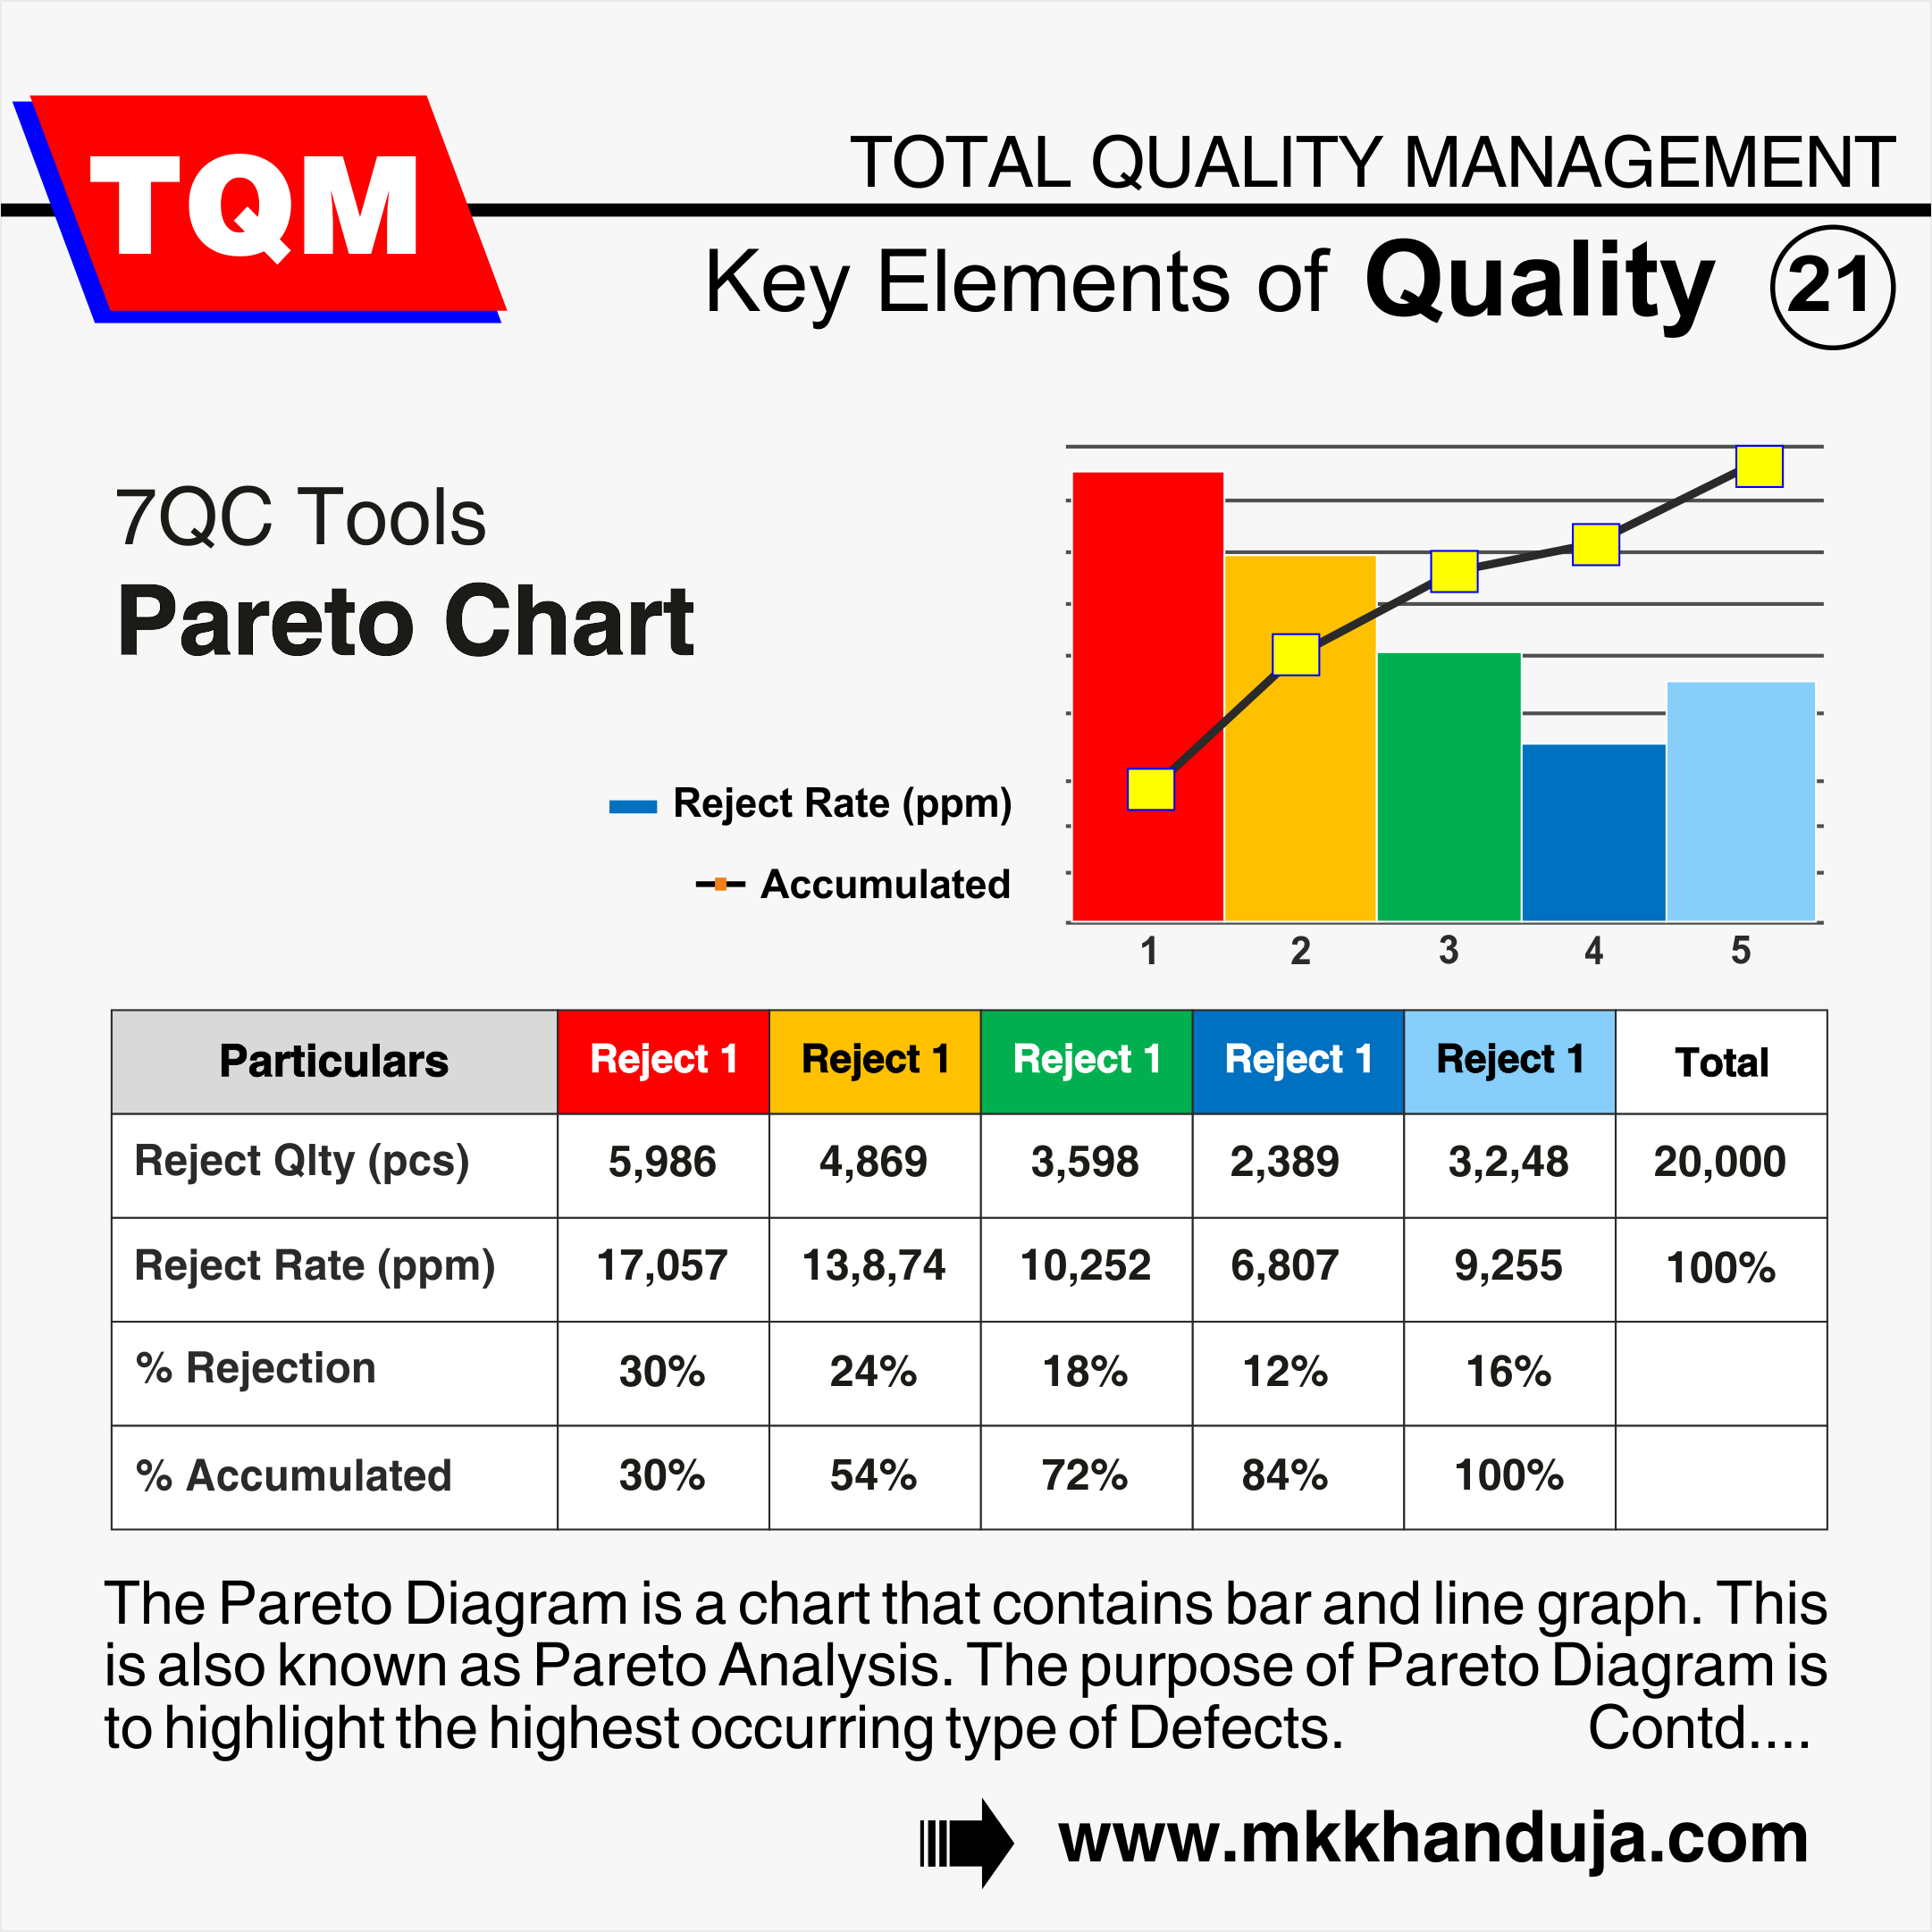
- To examine significant issues following Pareto analysis.
What Is The Use Of Cause and Effect
Diagram?
Cause and effect diagram is a helpful
graphical tool for locating and categorizing the known or potential sources of quality, or the
absence of it. The diagram's structure enables team members to think
in a very organized way. Here are some of the benefits
of constructing a Fish Bone Diagram.
- Employs a structured approach to assist in identifying the underlying causes of an issue or quality characteristic.
- Uses the process expertise of the group and encourages participation.
- Uses an easy-to-understand, systematic diagram to illustrate the relationships.
- Identifies potential reasons for variation in a process.
- Increases process knowledge by assisting everyone in understanding the factors at work and how they relate.
- Identifies areas which need data to be collected for more research.
Comments